
Your Guide to Every Essential eCommerce Kpi for 2026


Most advice about an e commerce KPI still treats the job like it's 2019. Track conversion rate. Watch AOV. Reduce abandonment. None of that is wrong. It's incomplete.
Those metrics still tell you whether the business is healthy. They don't tell you early enough why performance is moving, especially on marketplaces that now use AI to interpret product content, shopper intent, and review signals before a customer ever clicks. If your team is still measuring success with keyword rank and basic CTR alone, you're watching the scoreboard after the play is over.
The practical shift is simple. Traditional KPIs are still the destination. AI-driven content signals are now part of the map. On Amazon, Walmart, and other retail platforms, product discoverability is increasingly shaped by systems that reward clear, relevant, high-quality listings instead of mechanical keyword stuffing. That changes what smart teams measure, what they fix first, and how they connect content work to revenue.
The Foundational Financial KPIs You Must Track
AI has changed how shoppers discover products. It has not changed what the business has to produce. Revenue still comes down to a small set of financial KPIs that show whether your traffic, merchandising, and retention work is paying off.
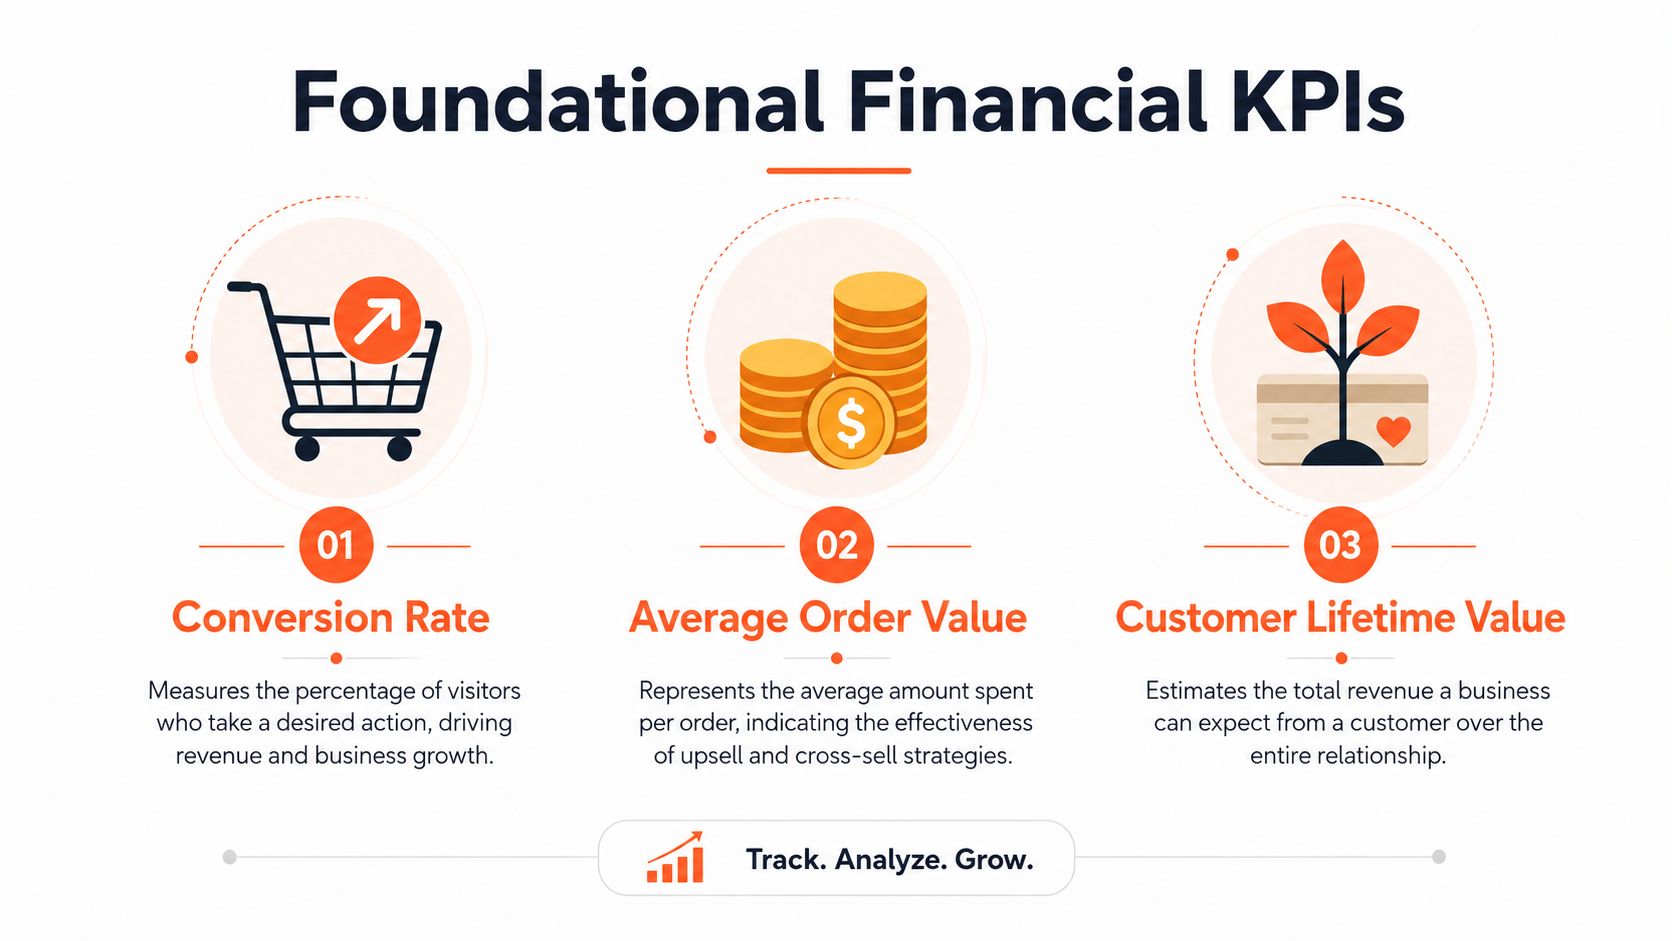
The practical distinction is this: financial KPIs are the scoreboard. They confirm whether your content quality, channel mix, pricing, and customer experience are producing profitable demand. They do not explain the cause by themselves, which is why teams that only watch the scoreboard react too late.
Conversion rate tells you whether traffic becomes revenue
Conversion rate is the primary e commerce KPI because it shows how efficiently visits turn into orders. The formula is (Total Transactions / Total Visits) × 100. In the United States, the average eCommerce conversion rate was approximately 1.84% in 2023, while top-performing brands in categories like fashion and beauty often reach 3% to 5%, according to Saras Analytics on ecommerce KPIs.
That spread is wide enough to matter. It usually reflects a mix of traffic quality, offer strength, page clarity, trust signals, and how well product content matches shopper intent.
On marketplaces influenced by AI search and recommendation systems, conversion rate becomes even more useful when you read it as a downstream result of content comprehension. If the platform cannot clearly interpret your product attributes, use cases, and relevance, you often pay for it later in weaker traffic quality and lower conversion. Teams investing in better product data and AI shopping assistants and chatbots for ecommerce should expect that work to show up here, not just in visibility metrics.
If conversion rate slips, avoid the reflex to cut price first. In practice, weak conversion often comes from mismatched traffic, confusing product detail pages, poor mobile usability, weak reviews, or content that answers the wrong shopper questions. If conversion stays healthy while margin stalls, the issue usually sits in basket size, discount dependence, or repeat purchase behavior.
Track conversion rate weekly by channel, device, and category. A sitewide average smooths over the very problems you need to find.
For a broader framework on how these metrics fit together, Trackingplan's Guide to ecommerce performance metrics is useful because it forces teams to look beyond one dashboard number.
AOV and CLV show whether growth is profitable and repeatable
Average Order Value measures how much revenue each order produces. Formula: Total Revenue / Number of Orders. In the U.S. eCommerce market, AOV typically ranges between $50 and $100 as of 2024, according to Stripe's overview of ecommerce KPIs.
AOV matters because growth built on small baskets can look healthy in top-line revenue while straining fulfillment costs and paid acquisition efficiency. Raising AOV sounds straightforward, but the trade-off is real. Aggressive bundles, thresholds, and upsells can lift basket size while hurting conversion if the offer feels forced or irrelevant.
Customer Lifetime Value answers a different question. It estimates what a customer is worth across the relationship, not just the first transaction. One accepted formula is Average Order Value × Purchase Frequency × Retention Period.
Read these metrics together:
High conversion, low AOV points to weak basket building, limited cross-sell success, or a product mix skewed toward low-ticket items.
Healthy AOV, weak CLV usually means you are good at winning the first order and weaker at retention, replenishment, or post-purchase experience.
Strong CLV gives you more room to spend on acquisition, test new channels, and improve content without putting the model under immediate pressure.
A useful benchmark sits underneath all three metrics. Many operators use a CLV to CAC ratio of at least 3:1 as a healthy target. That ratio is not just a finance check. It tells you how much inefficiency your acquisition, merchandising, and content systems can absorb before growth starts destroying profit.
Measuring Your Shopper Engagement Funnel
A physical store makes this easier to understand. Traffic is footfall. Your listing thumbnail, ad, or search result is the window display. Product pages are the shelf and packaging. Add-to-cart is the moment a shopper puts the item in the basket.
If too many people walk past the store, the message is weak. If they walk in and leave, the experience disappoints. If they browse but don't add anything to cart, the product page isn't doing its job.
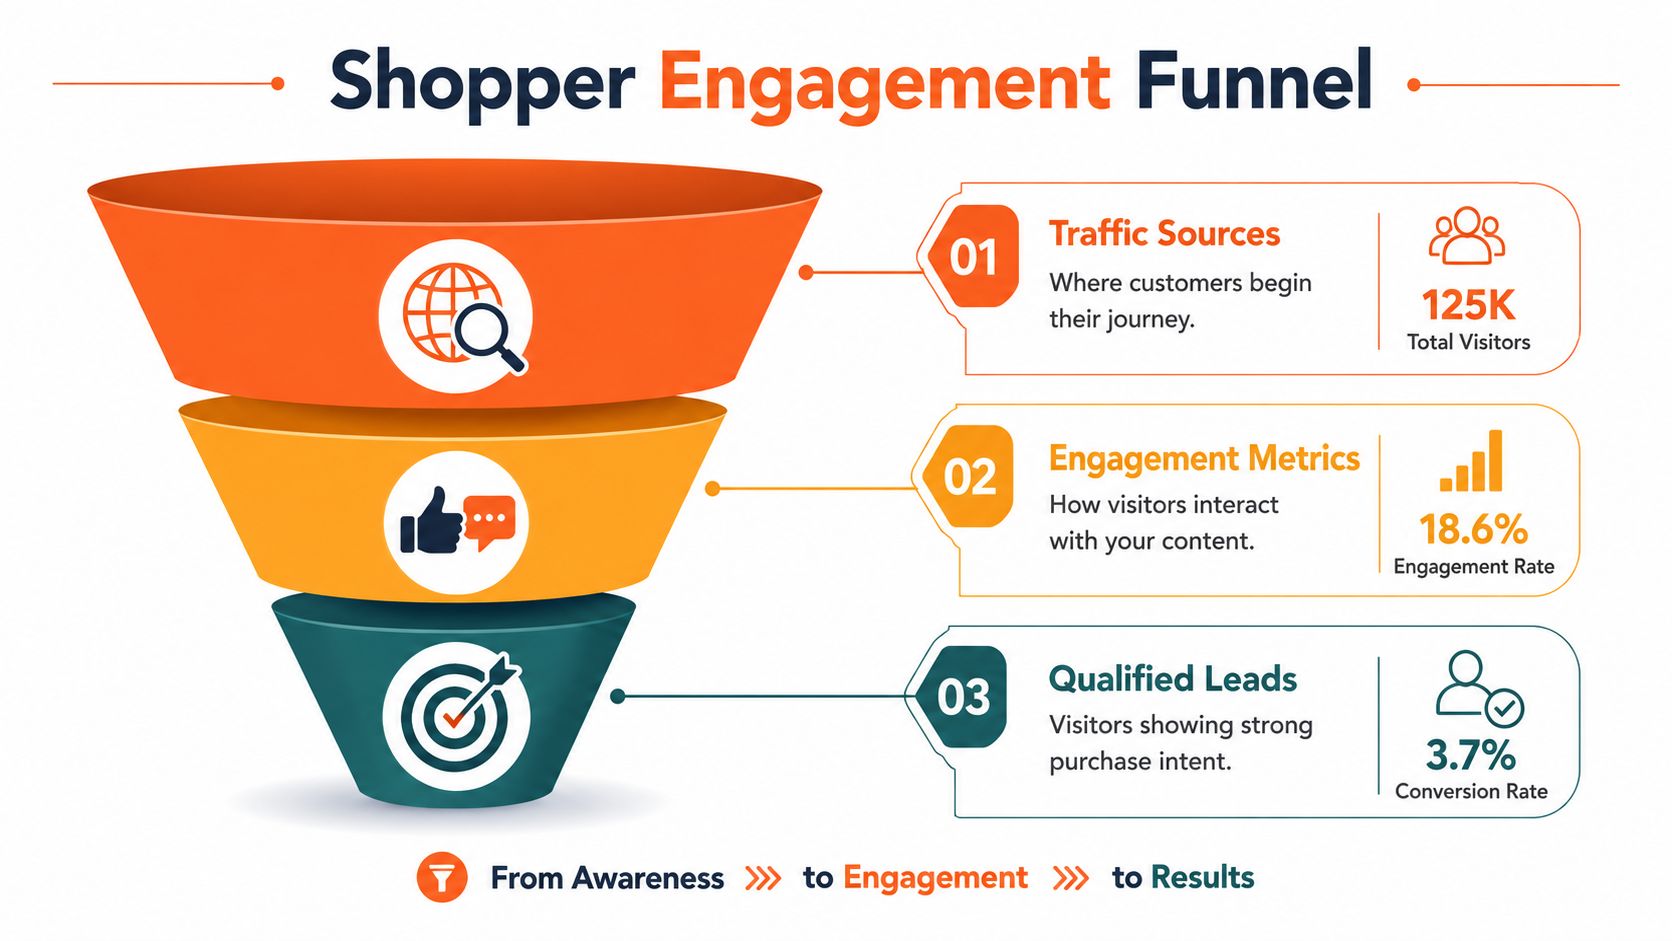
Watch where interest drops
The most useful engagement metrics sit before purchase:
Traffic sources tell you where intent begins. Marketplace search, paid traffic, email, influencer mentions, and organic brand demand behave differently.
Click-through rate tells you whether your title, image, price, and promise earn attention.
Bounce rate shows whether the landing experience matches what the shopper expected.
Add-to-cart rate tells you whether the product page creates buying intent.
The key metric here is Add-to-Cart Rate, calculated as (Sessions with add-to-cart / Total sessions) × 100, according to NetSuite's ecommerce KPI guide. When it's low, the issue often sits on the product detail page. Bad images, vague benefits, confusing descriptions, or pricing that doesn't feel competitive.
Diagnose the product page before blaming checkout
Teams often blame checkout too early. Sometimes checkout is the problem. Often, the problem started earlier because the shopper never built enough confidence to move forward.
Use this quick diagnostic:
High clicks, low engagement means your promise pulled people in, but the page didn't back it up.
Solid engagement, weak add-to-cart usually points to PDP quality. Think image order, bullets, FAQs, compatibility details, or review clarity.
Strong add-to-cart, weak final purchase suggests checkout friction, shipping surprises, or trust issues later in the funnel.
A low add-to-cart rate is usually not a traffic problem. It's a message and merchandising problem.
This is also where conversational support can help close uncertainty before abandonment starts. If your team is exploring buyer guidance during consideration, this practical read on chatbots for ecommerce is worth a look because it focuses on the shopper questions that block action, not just automation for its own sake.
The Big Shift From Keywords to AI Comprehension
Keyword-based optimization used to be a decent proxy for discoverability. Put the right terms in the title, bullets, backend fields, and ad copy, and you had a fighting chance. That model hasn't disappeared entirely, but it no longer explains enough of what happens on major marketplaces.

Amazon made the shift visible by replacing Rufus with Alexa for Shopping, now embedded directly into the main Amazon.com search bar, where shoppers can ask natural-language questions and receive recommendations, comparisons, and price-history context through a conversation flow, as detailed in Amazon's announcement about Alexa for Shopping. That's a different discovery layer than traditional search.
AI assistants don't read listings like old search engines
Here's what changes in practice. A shopper doesn't just type “vitamin c serum.” They ask, “What's a good skincare routine for men?” or “Which water bottle is best for commuting and easy to clean?” An AI assistant has to interpret intent, compare products, weigh clarity, and decide which listings are useful.
That makes old habits less reliable. Repeating phrases can still satisfy a checklist. It doesn't necessarily help an assistant understand who the product is for, what problem it solves, or when it's the right choice.
The change is already material. 68% of Amazon shoppers now use AI assistants to find products, which makes semantic relevance score more useful than keyword match rate, because AI systems re-rank content based on intent rather than density, according to Stripe's analysis of ecommerce KPIs and AI search behavior.
Amazon won't be the only marketplace that works this way
Amazon is just the clearest example. Walmart's Sparky and other retail AI assistants point in the same direction. Major marketplaces are rewiring discovery around understanding, not just indexing.
That means a listing can be technically “optimized” in the old SEO sense and still perform badly in AI-led search if it's unclear, repetitive, shallow, or mismatched to shopper language. Teams that want a useful grounding in this transition should review modern ecommerce SEO strategies through the lens of AI comprehension, not just ranking mechanics.
The listing that wins in AI search is usually the one a real shopper can understand fastest.
The New KPIs for an AI-Powered Marketplace
If the old model was keyword visibility, the new model is interpretability. That requires a different set of leading indicators. These aren't replacements for revenue KPIs. They're the signals that increasingly shape whether a shopper ever sees the product in the first place.
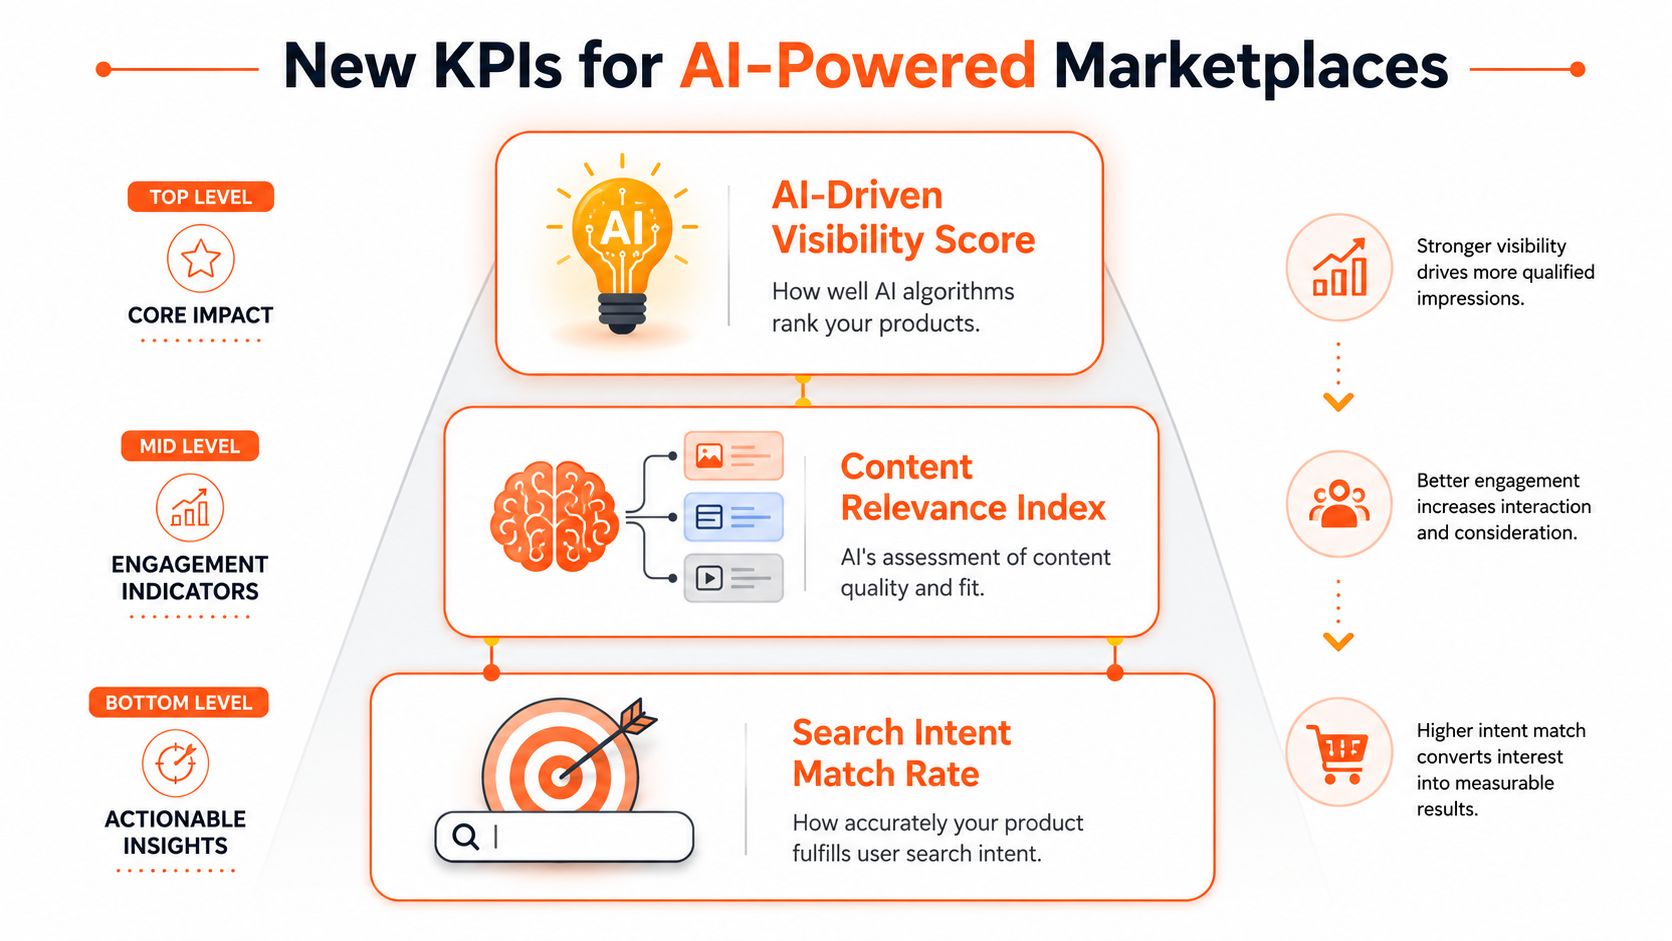
Semantic relevance matters more than keyword stuffing
Semantic relevance score is the clearest way to think about discoverability now. It asks whether your listing answers the intent behind a query, not whether it mechanically repeats the phrase. For a protein powder, “grass-fed whey isolate for post-workout recovery” communicates use case and fit better than a title crammed with repeated category terms.
This becomes critical when AI assistants summarize, compare, and recommend products instead of just listing them.
Content quality is now a measurable performance issue
Amazon's shift has raised the importance of content quality score. With Alexa for Shopping now defaulted in Amazon search, discoverability has moved toward AI comprehension. Listings need to satisfy Amazon's internal CoSMo model, which evaluates relevance and clarity across 15+ dimensions, making content quality the key lever for visibility, according to coverage of how Alexa changes Amazon shopping behavior.
A useful way to think about content quality is through three checks:
Clarity: Can a shopper immediately understand the product, use case, and fit?
Completeness: Does the page answer the obvious questions that block purchase?
Consistency: Do title, bullets, images, and reviews tell the same story?
A short video can help make this shift concrete.
Voice of Customer is no longer a support-only signal
The third KPI category is Voice of Customer sentiment. Reviews used to sit in a separate bucket. Merchandising handled content. CX handled complaints. That split doesn't hold up well in AI-driven marketplaces.
When shoppers ask an assistant for the best option, the assistant has to interpret what customers say about comfort, durability, irritation, smell, fit, or ease of use. If your listing promises one thing and the reviews consistently describe another, that inconsistency hurts discoverability and conversion.
Operational takeaway: Review analysis isn't just for fixing products. It's for rewriting listings so the product promise matches the language customers already use.
Connecting Content Optimization to KPI Growth
A bad marketplace listing usually doesn't fail because it lacks words. It fails because it gives the wrong words too much space and the right words too little structure.
Take a common example. A skincare brand uploads a serum with a title overloaded by category phrases, bullets that repeat “hydrating” without explaining skin type or routine placement, and a description that reads like internal brand copy. The images look polished, but they don't clarify texture, use order, or who should avoid the product. In old-school marketplace SEO, that might pass for “optimized.” In AI-led discovery, it often reads as vague.
What a weak listing looks like
The typical before-state has a few recognizable symptoms:
Title inflation where every phrase fights for space but no clear use case stands out
Bullets without decision value because they list features but not shopper-relevant outcomes
Review mismatch where customer language says one thing and the listing says another
That combination depresses the metrics upstream of revenue. AI systems struggle to classify the product cleanly. Shoppers hesitate on the page. Add-to-cart softens before checkout ever has a chance.
What the improved version does differently
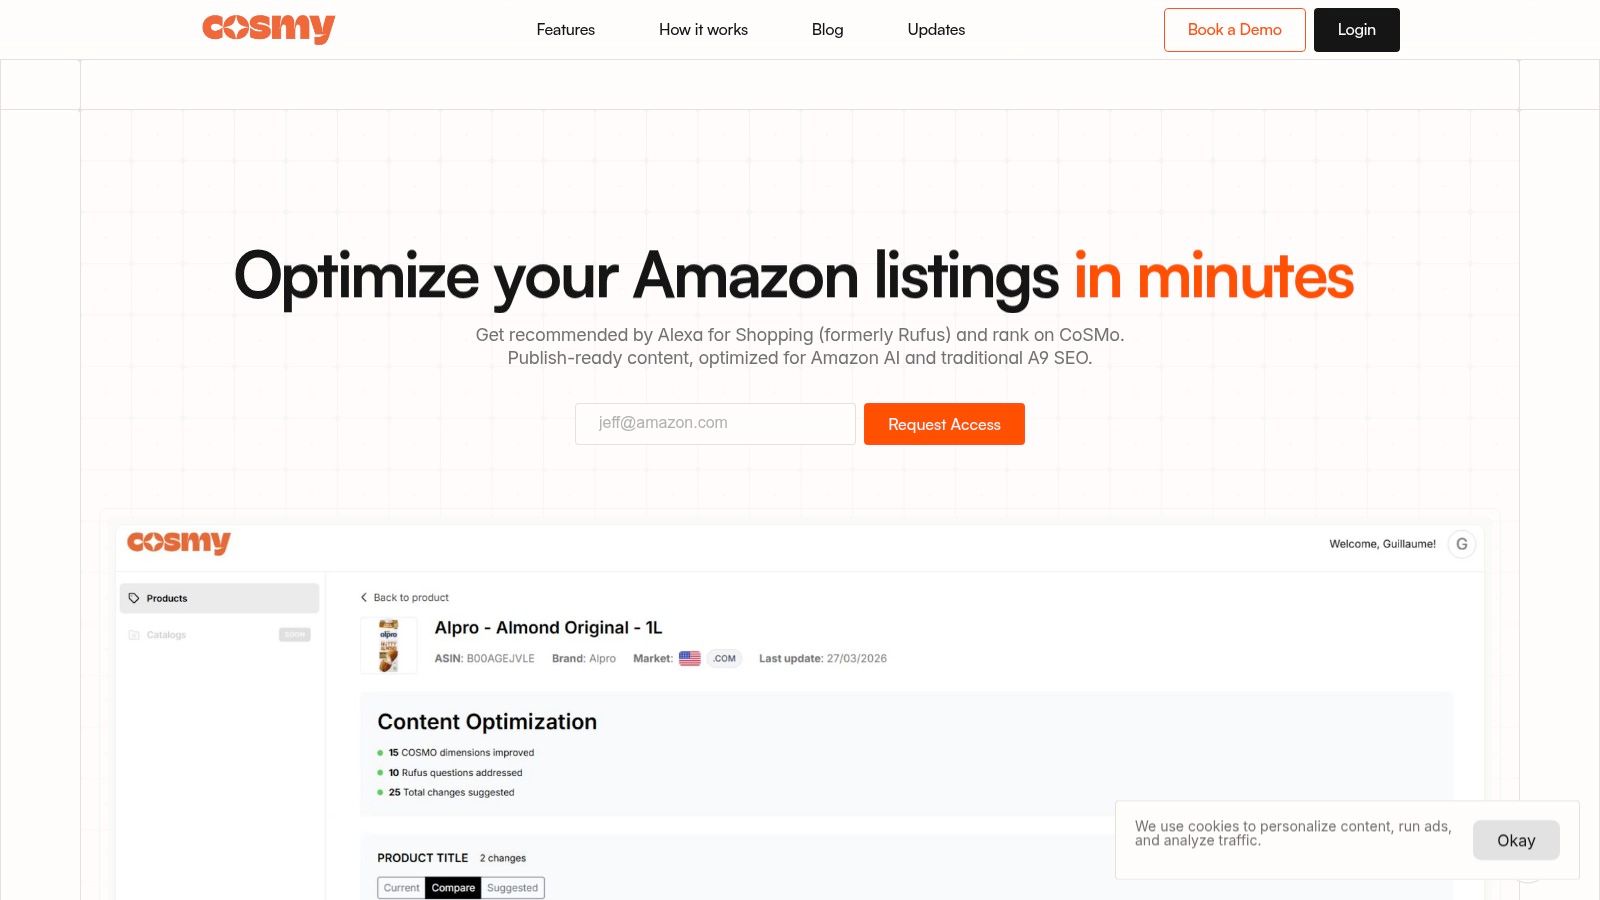
A stronger after-state usually looks simpler, not more elaborate. The title names the product and primary use case clearly. The bullets answer practical questions in the order a shopper asks them. The description supports comprehension instead of repeating terms. Review themes get reflected in the copy, especially around benefits and objections.
Here's the chain reaction that matters:
Listing improvement | Immediate KPI effect | Business effect |
|---|---|---|
Clearer title and bullets | Better semantic relevance | More qualified discovery |
Better image and copy alignment | Higher shopper confidence | More add-to-cart behavior |
Review-informed messaging | Stronger fit with buyer intent | Better conversion quality |
One of the better outside perspectives on this wider shift is the MyMentions blog on AI visibility, especially its focus on how AI systems synthesize brand signals rather than just index pages. The same logic applies to marketplaces. Discovery improves when product content is easier for machines to interpret and easier for humans to trust.
If your team is rewriting Amazon detail pages, a more channel-specific Amazon content strategy helps because the best rewrite work starts with shopper questions, not keyword volume exports.
Better content doesn't just increase readability. It changes who sees the product, what they expect, and whether they arrive ready to buy.
How to Prioritize KPIs by Goal and Channel
A single KPI dashboard creates false clarity.
Amazon growth, DTC profitability, and retention are different operating problems. They need different scorecards, different owners, and different response times. If you judge every channel by the same handful of numbers, you usually end up overreacting to lagging metrics and missing the upstream issue that caused them.
Match the KPI to the decision you need to make
Start with the business decision. Then choose the KPI that can change that decision.
If the goal is faster growth on Amazon, watch the metrics that sit closest to discovery and product-page momentum. If the goal is better cash efficiency, put customer value and acquisition payback first. If paid acquisition is scaling but margins are tightening, compare acquisition cost against the value those customers produce over time.
The LTV:CAC ratio matters here because it prevents teams from calling expensive growth a win. A healthy ratio gives you room to buy traffic, absorb volatility, and keep margin intact. For a useful outside view on tying metrics back to operating decisions, see driving profit with ecommerce data.
KPI Prioritization Matrix
Business Goal | Primary KPIs | Secondary KPIs |
|---|---|---|
Grow market share on Amazon | Content quality score, semantic relevance, add-to-cart rate | Conversion rate, Voice of Customer sentiment |
Improve DTC profitability | CLV, AOV, LTV:CAC ratio | Conversion rate, traffic quality |
Fix product page underperformance | Add-to-cart rate, bounce behavior, content clarity | Review sentiment themes, conversion rate |
Expand into AI-led retail discovery across Amazon, Walmart, and other marketplaces | Semantic relevance, content quality model alignment, shopper intent match | Category conversion trends, review alignment |
Improve retention on repeat-purchase products | CLV, review sentiment, offer relevance | AOV, first-to-second-order experience |
Don't flatten channel differences
Amazon, Walmart, and your own storefront can all produce revenue, but the path to that revenue is different.
On marketplaces, traffic is filtered through platform systems that increasingly evaluate relevance, content completeness, and shopper intent match before a shopper ever sees the listing. That shifts your leading indicators upstream. A weak add-to-cart rate may still be a conversion problem, but poor semantic alignment or unclear copy can suppress visibility before conversion even has a chance to improve.
DTC works differently. Your team controls more of the funnel, so merchandising, landing-page testing, email, SMS, and offer structure usually have a more immediate effect on AOV, repeat rate, and margin.
Agencies and multi-brand operators need both views at once. One layer should track financial outcomes by channel. Another should track the inputs that shape those outcomes, especially listing quality and AI comprehension on marketplaces.
The practical rule is simple. Prioritize the KPI that reflects the current bottleneck in that channel, then assign it to the team that can change it. Merchandising can fix weak product-page clarity. Paid media can fix inefficient acquisition. CRM can fix repeat purchase flow. Finance should measure the outcome, not own the content work that creates it.
Your Next Steps in Mastering eCommerce KPIs
Teams don't need more metrics. They need a cleaner split between lagging financial KPIs and leading discovery KPIs.
The lagging side is familiar. Conversion rate tells you whether visits become orders. AOV tells you how much each order is worth. CLV tells you whether growth compounds or resets every month. Those numbers still decide whether the business works.
The leading side is where the operating model has changed. On Amazon, Walmart, and similar retail platforms, content quality, semantic relevance, and review alignment increasingly shape whether a product gets surfaced by AI systems at all. That means product content is no longer just a merchandising asset. It's a performance asset.
A practical operating checklist
Use this as a working list for your team:
Audit top listings: Review your highest-value products for clarity, completeness, and use-case alignment.
Read reviews for language: Pull recurring phrases from customer feedback and compare them against title, bullets, and description.
Check intent match: Test whether the listing answers natural-language shopping questions, not just category keywords.
Watch pre-purchase behavior: Use add-to-cart and engagement signals to find pages that are underperforming before checkout.
Separate channel priorities: Run one KPI view for marketplace discoverability and another for DTC profitability.
Tie content work to business outcomes: Rewrites should have a clear expected impact, such as better qualified traffic or stronger conversion quality.
A useful companion read is MetricMosaic's piece on driving profit with ecommerce data, especially if your team needs help turning dashboard review into operational decisions instead of passive reporting.
The main shift is straightforward. Don't abandon traditional KPIs. Keep them as the scorecard. But stop pretending they're enough to explain performance in AI-shaped commerce. The brands that win now are measuring what happens before the click, before the cart, and before the sale.
If your team needs help turning Amazon listings into content that AI shopping assistants can interpret, Cosmy gives you a practical workflow. It audits listings through the lens of Alexa for Shopping and CoSMo, surfaces content gaps, and generates publish-ready title, bullets, and description copy built for modern marketplace discoverability.